> For the complete documentation index, see [llms.txt](https://docs.opendatadiscovery.org/llms.txt). Markdown versions of documentation pages are available by appending `.md` to page URLs; this page is available as [Markdown](https://docs.opendatadiscovery.org/features/active-platform-features/alerting.md).
# Alerting
Per-entity alerts for failed jobs, failed DQ tests, backwards-incompatible schema changes, and injected distribution anomalies — tracked through an OPEN → RESOLVED lifecycle with per-entity halt.

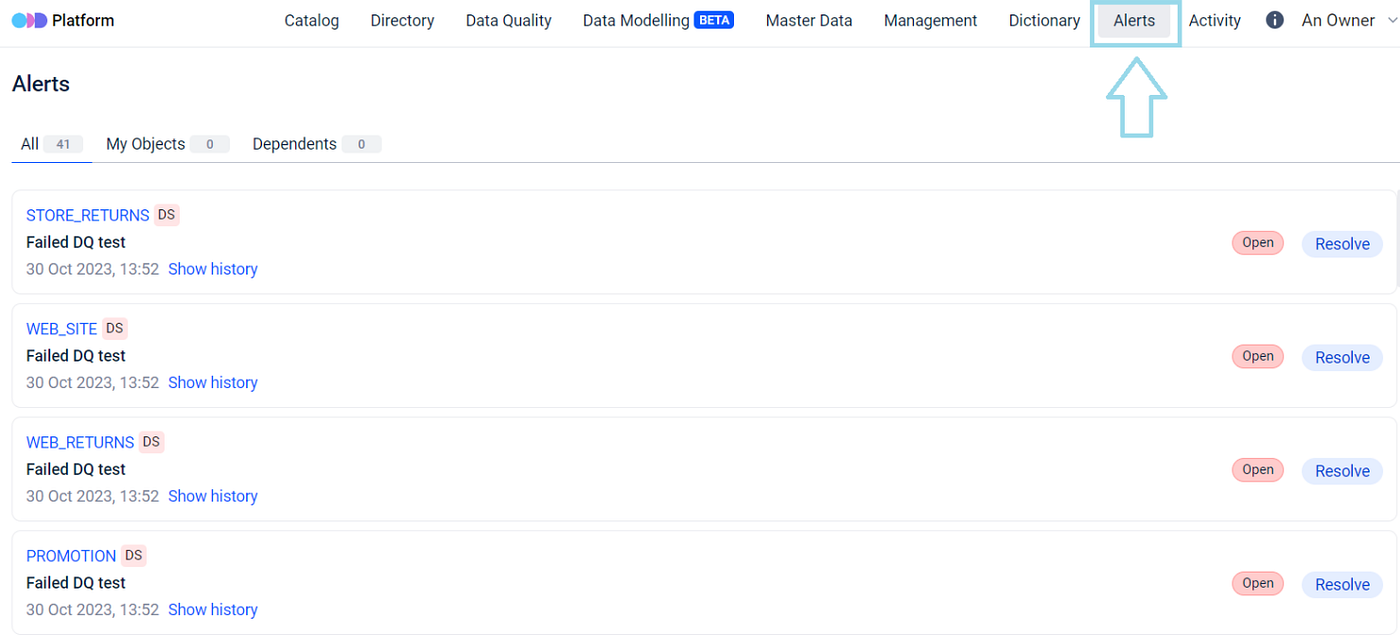
Whenever an issue arises with a catalogued entity — a failed job, a failed data quality test, a backwards-incompatible schema change, or an externally-injected distribution anomaly — the platform raises an **alert** visible in the navigation pane's `Alerts` section and on each affected entity's own Alerts tab.
Alerts section on the navigation pane
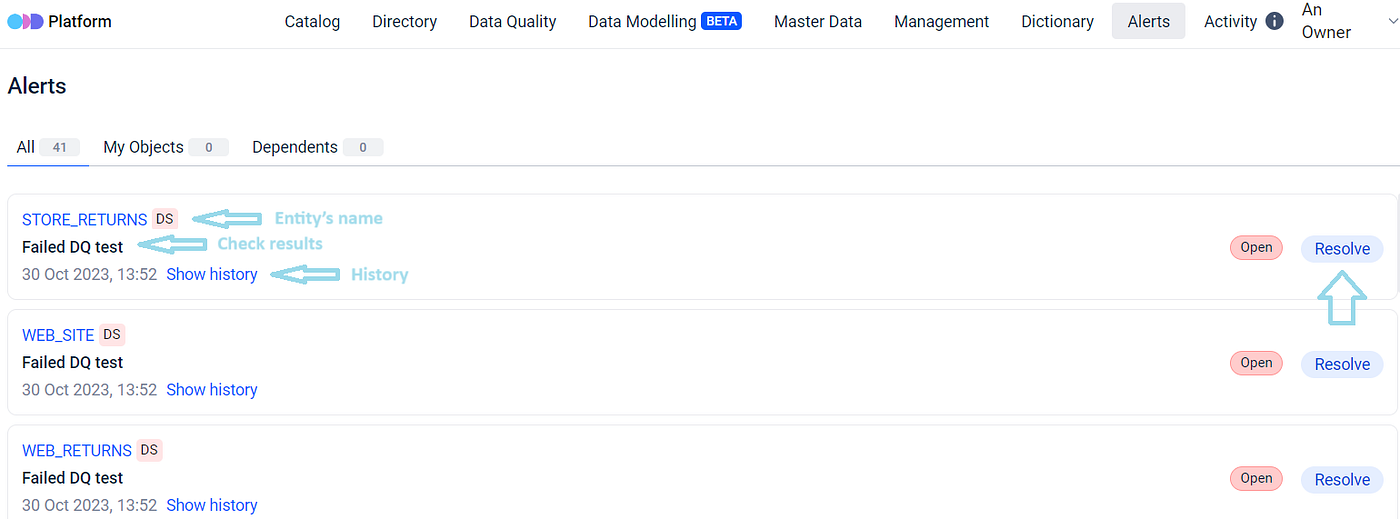
Each alert carries the affected entity, the alert type, the triggering timestamp, status history, and a Resolve action; resolving an alert updates the same record in place.
Alert notification details
Alerts are persisted the moment they are raised — a plain insert on the platform's own ingestion / evaluation pipeline — so the alert record exists independently of whether any outbound delivery channel (Slack, email, webhook) is configured.
## Alert types
The platform tracks four alert types:
* **Failed job** — a transformer entity's most recent run reported failure.
* **Failed data quality test** — a quality-test entity's most recent run reported failure.
* **Backwards incompatible schema change** — a producer dropped something a downstream consumer was relying on (see [Backwards-incompatible schema change](#backwards-incompatible-schema-change-what-triggers-it) for the detection rules).
* **Distribution anomaly** — anomalous distributions detected externally and pushed in via Prometheus AlertManager (see the inbound webhook description in [Notifications](/features/active-platform-features/notifications.md)).
Alerts originate from two sources: the platform's own ingestion / evaluation pipeline (for the first three types and any other internal triggers), and optionally from an external [Prometheus AlertManager](https://prometheus.io/docs/alerting/latest/alertmanager/) via the `POST /ingestion/alert/alertmanager` inbound webhook. AlertManager-routed alerts surface as **Distribution Anomaly** alerts using the `entity_oddrn` label to attribute them to the affected entity. The setup steps for the AlertManager integration live on [Notifications → Prometheus AlertManager inbound webhook](/features/active-platform-features/notifications.md#prometheus-alertmanager-inbound-webhook).
How an alert leaves the platform — Slack, email, generic webhook, plus the AlertManager-driven inbound path — is its own subsystem; see [Notifications](/features/active-platform-features/notifications.md).
### Inbound AlertManager webhook — operator caveats
The live page above already discloses that the `POST /ingestion/alert/alertmanager` endpoint is not authenticated (the platform's Spring Security configuration whitelists `/ingestion/**` for collectors, and the AlertManager path inherits that whitelist). Three additional operator-visible behaviours sit on top of that disclosure — each of them load-bearing for any deployment whose AlertManager is reachable from outside an operator-trusted network.
{% hint style="danger" %}
**Anyone with network reach to the webhook can inject a forged Distribution Anomaly on any catalogued entity.** The handler reads the `labels.entity_oddrn` from the request body and writes it to the new alert's `data_entity_oddrn` column with **no existence check, no ownership check, no permission check**. Combined with the unauthenticated endpoint, any caller — anonymous under `auth.type=DISABLED`, any authenticated user otherwise — can `POST` an `entity_oddrn` pointing at any other team's dataset and surface a false-positive Distribution Anomaly on that entity. The forged alert appears on the platform-wide **All** tab (cross-team readable today) and is indistinguishable from a real anomaly to the reviewer working the queue.
**Mitigation today:** place the platform behind a private network or an operator-controlled ingress that restricts who can reach `/ingestion/alert/alertmanager`. Until the upstream gate-or-shared-secret hardening ships, the webhook should be considered authoritative only from the trusted AlertManager instance; do not expose it on the public internet.
{% endhint %}
{% hint style="danger" %}
**The `generatorURL` from the AlertManager payload is embedded verbatim into the alert description — a stored-XSS / open-redirect surface.** The handler builds the alert's description by string-formatting the parsed generator URL into the body (`"Distribution Anomaly. URL: %s"`). The URL parser does not block `javascript:` or `data:` schemes, and the alert description is rendered as HTML on the UI's Alerts surface. Combined with the unauthenticated endpoint above, any caller can plant a `javascript:` URL (or an attacker-controlled redirect target) that fires when another operator opens the alert.
**Mitigation today:** the same network-layer restriction as above. The upstream fix is a scheme allow-list on the inbound URL plus UI-side sanitisation.
{% endhint %}
{% hint style="warning" %}
**Prometheus retries duplicate alerts in the UI — the webhook handler has no idempotency key.** The platform writes each inbound `ExternalAlert` as a new `INSERT` with no `ON CONFLICT` clause. Prometheus's default retry policy re-sends webhook payloads on any transient network blip; each retry creates a fresh alert row visible alongside the original. The in-platform alert path (failed-job, failed-DQ, schema-change) deduplicates at the application layer, but the AlertManager path bypasses that layer.
**Mitigation today:** if duplicate visibility is unacceptable, tune Prometheus AlertManager's `send_resolved: false` and lengthen `repeat_interval` so retries reach the platform less often. The upstream fix is an idempotency key on the inbound payload (or `ON CONFLICT DO NOTHING` on the platform-side insert).
{% endhint %}
## Alert views — All, My Objects, Downstream, Upstream
The `Alerts` section in the navigation pane is an Activity-style view: a left **filter panel** plus a results pane with four tabs that scope the alert list to different slices of the platform. Pick the tab that matches how you're working the queue — on large deployments the default `All` view can run into the hundreds of open alerts, and the `My Objects` / `Downstream` / `Upstream` tabs let individual owners cut the list down to what they're responsible for.
| Tab | Scope | When to use |
| -------------- | --------------------------------------------------------------------------------------------------------- | ----------------------------------------------------------------------------------------------------------------------------------------------------------------- |
| **All** | Every alert across the whole platform (matching the active filters). | Platform-wide triage; stewards and admins watching the full alert surface. |
| **My Objects** | Alerts raised on data entities where the signed-in user is a registered owner. | Per-owner view — "what fires on the things I own". Requires user ↔ owner association. |
| **Downstream** | Alerts raised on data entities that are **downstream** of entities the signed-in user owns (via lineage). | Impact view — "what's breaking in systems that consume my data". Surfaces ripple effects before the downstream team pings you. Requires user ↔ owner association. |
| **Upstream** | Alerts raised on data entities that are **upstream** of entities the signed-in user owns (via lineage). | Root-cause view — "what's failing in the systems my data depends on". Requires user ↔ owner association. |
The old single **Dependents** tab — which showed downstream alerts only — is now split into the two explicit lineage directions, **Downstream** and **Upstream**.
The tabs are **query-parameter driven** (`?type=ALL|MY_OBJECTS|DOWNSTREAM|UPSTREAM`), not separate routes; switching tabs changes the `type` parameter on the same `/alerts` page. The badge counts next to each tab react to the active filters but **not** to the selected tab, so you can see how many alerts each view holds under the current filter set before switching to it.
### Filter panel
The left panel filters every tab on the global Alerts page. The filters apply to the list **and** to the per-tab badge counts:
| Filter | What it scopes to |
| -------------- | --------------------------------------------------------------------------------------------------------------------------------------------------------------------------- |
| **Period** | Alerts whose triggering event falls in the chosen date-time range. Left unset by default, so the unfiltered view is "all alerts" rather than "alerts in the last *N* days". |
| **Datasource** | Alerts on entities belonging to the chosen datasource. |
| **Namespace** | Alerts on entities in the chosen namespace. |
| **Tag** | Alerts on entities carrying the chosen tag(s). |
| **Owner** | Alerts on entities owned by the chosen owner(s). |
| **Status** | Alerts in the chosen lifecycle status — `OPEN`, `RESOLVED`, or `RESOLVED_AUTOMATICALLY`. |
{% hint style="info" %}
**The global views default to `OPEN`, and resolved alerts are reachable via the Status filter.** Out of the box the Status filter is set to **Open**, so every global tab opens on the active work queue. To read resolved history platform-wide, change **Status** to `RESOLVED` or `RESOLVED_AUTOMATICALLY` (or clear it to see every status) — the resolved alerts are returned on the same global tabs, no longer only through the per-entity view. (In the previous release the global tabs were hardwired to `OPEN` and resolved history was reachable only per-entity; the Status filter removes that restriction.)
{% endhint %}

The endpoints behind the four tabs (`getAlertsList`) and the badge-counter call (`getAlertCounts`) are documented at [API Reference → Alerts → Global alert listings](/developer-guides/api-reference/alerts.md).
{% hint style="info" %}
The `My Objects`, `Downstream`, and `Upstream` tabs are hidden unless the signed-in user is linked to an [Owner](/configuration-and-deployment/enable-security/authorization/user-owner-association.md) — without the association, the platform cannot evaluate "mine", "downstream of mine", or "upstream of mine". An operator who sees only the `All` tab almost always has a missing user-owner link. This is a different `My Objects` from the **Recommended → My Objects** wizard on the main page — the wizard surfaces recently-ingested owned entities; this tab filters alerts.
{% endhint %}
## Alert lifecycle: statuses, resolution, cleanup
Every alert moves through three statuses:
| Status | What it means | Who sets it |
| ---------------------------- | ----------------------------------------------------------------------------------------------------------------------------------------------------------------------- | --------------------------------------------------------------------- |
| **`OPEN`** | The alert is active. It shows on the entity's Alerts tab and, in the default (Open) global view, counts toward the **All / My Objects / Downstream / Upstream** badges. | The platform, when the alert is created. |
| **`RESOLVED`** | An operator marked the alert resolved by hand — typically after fixing the underlying issue or judging it a false positive. | An operator, via the `Resolve` action on the alert. |
| **`RESOLVED_AUTOMATICALLY`** | The platform itself resolved the alert because the condition that fired it has cleared (see below). No operator acted. | The platform, on the next ingest that observes the cleared condition. |
The two resolved statuses behave the same way — both clear the alert from open counts and stop notifications, and both drop the alert out of the **default (Open)** global view across the **All / My Objects / Downstream / Upstream** tabs. They are not gone, though: set the global **Status** filter to `RESOLVED` or `RESOLVED_AUTOMATICALLY` (or open the entity's own Alerts tab) to bring them back. The distinction between the two resolved statuses is preserved on the alert record and in the [Activity Feed](/features/active-platform-features/activity-feed.md), so you can tell whether an alert was worked on or simply cleared itself. Auto-resolution events are recorded as system events on the feed; manual resolutions carry the operator's identity.
### Auto-resolution triggers
Auto-resolution applies to **`Failed job`** and **`Failed data quality test`** alerts only. The other two alert types — `Backwards incompatible schema change` and `Distribution anomaly` — never auto-resolve and stay `OPEN` until an operator resolves them by hand.
The trigger is the next ingest that reports a **successful** run for the same task on the same entity:
* If a job that previously failed succeeds on its next run, the open `Failed job` alert for that entity flips to `RESOLVED_AUTOMATICALLY`.
* If a data-quality test that previously failed passes on its next run, the open `Failed data quality test` alert for that test flips to `RESOLVED_AUTOMATICALLY`.
A subsequent failure opens a **new** alert; auto-resolved alerts are not reopened.
{% hint style="info" %}
**Manual reopen has a guard.** An operator can reopen a `RESOLVED` or `RESOLVED_AUTOMATICALLY` alert by sending its status back to `OPEN` (`PUT /api/alerts/{alert_id}/status`) — but only if there is **no other open alert of the same type** on the same data entity. The platform refuses the reopen with `Cannot reopen alert since the system already has an open alert of the same type`. Resolve or work the newer alert first, or leave the old one closed.
{% endhint %}
### Auto-cleanup of resolved alerts
Resolved alerts do not accumulate forever. The platform's housekeeping job **permanently deletes** resolved alerts — **both** manually resolved (`RESOLVED`) and auto-resolved (`RESOLVED_AUTOMATICALLY`) — whose status-update timestamp is older than `housekeeping.ttl.resolved_alerts_days` (default `30` days). The chunk records attached to each alert are deleted along with it — this is a hard delete, not a soft one, so once the window passes the alert is gone from the database. The two resolution kinds are treated **symmetrically**: a freshly resolved alert (manual or automatic) lives its full retention window before it becomes eligible for deletion.
To change the retention window, see [Housekeeping Settings Configuration](/configuration-and-deployment/odd-platform.md#housekeeping-settings-configuration). Raise the value before resolved alerts age out if you need a longer audit trail; once deleted, alerts cannot be recovered.
{% hint style="info" %}
**Both manual and automatic resolutions respect `resolved_alerts_days`.** The cleanup predicate is `(status = RESOLVED OR status = RESOLVED_AUTOMATICALLY) AND status_updated_at <= cutoff`, so an alert is purged only after it has been resolved for longer than the window — there is no asymmetry between the two resolved states. (An earlier revision of this page described a manual-resolution retention bug from reading the job's jOOQ predicate as raw SQL precedence; that is not how the platform behaves — verified against the running job. The one real footgun is leaving `resolved_alerts_days` **unset** under a partial `housekeeping.ttl` override: an unset value binds to `0`, which deletes resolved alerts immediately — always set it explicitly, as the shipped default does.)
{% endhint %}
#### Reading the per-entity alert history — endpoint notes
The per-entity Alerts tab reads through `GET /api/dataentities/{data_entity_id}/alerts/list` (Period + Status filterable), and `GET /api/dataentities/{data_entity_id}/alerts/list?size=…` is also the path operators script when exporting an entity's alert history for a compliance archive or a postmortem. That read path has three properties that materially affect how operators must use it:
* **Pagination defaults silently truncate.** The endpoint accepts `page` and `size` query parameters but has no `@Min` / `@Max` validation and no `minimum` / `maximum` in the OpenAPI declaration. A small page size or a forgotten `size=` parameter silently caps the export; operators preserving the full audit history before a compliance-driven manual-resolve cycle should pass an explicit large value (e.g., `size=1000`) and continue paginating until the page is short. Default values can truncate without warning.
* **The read is inclusive of soft-deleted entities.** The endpoint reads through `existsIncludingSoftDeleted`, which returns alert history for entities whose own `status` is `DELETED`. Soft-deleted entities are hidden from the catalog's list surfaces but their alert history is still readable through this endpoint — useful for forensic recovery, surprising to operators who assume soft-delete extends to the alert-history layer.
* **There is no per-owner scoping at the endpoint layer.** The per-entity repository query has no `OWNERSHIP` join (contrast with the `My Objects` global view, which restricts to entities the signed-in user owns). Any authenticated user reads any data entity's alert history through this endpoint, regardless of which owners are linked to the entity. Operators reasoning about "per-team alert visibility" cannot enforce it at this URL today.
(Bulk-resolve and a UI export affordance are still absent — there is no "resolve all" control and no download button on either the global or per-entity Alerts surface; resolve alerts one at a time, and script the listing endpoints above when you need the data out of the platform.)
## Backwards-incompatible schema change — what triggers it
`Backwards incompatible schema change` is the alert type that fires when a producer drops something a downstream consumer was relying on. The platform compares the **previously-ingested** version of an entity to the **latest** ingest and raises this alert whenever any of three classes of removal is detected. **Adding** fields, sources, targets, or inputs is not a backwards-incompatible change and does not trigger an alert. For the user-facing diff surface (where every column add / remove / type change is rendered on the dataset's Structure tab, alert or not), see [Schema diff](/features/data-discovery/schema-diff.md).
The three detection paths:
| Entity class | What triggers an alert | Detail |
| --------------- | -------------------------------------------------------------------------------------------------------------------------------- | ------------------------------------------------------------------------------------------------------------------------------------------------------------------------------------------------------ |
| **Dataset** | A field that existed in the previous version is no longer present in the latest version, **or** a field's data type has changed. | Fields are compared by `(oddrn, type)`. Removing a column, renaming it (the new name produces a different ODDRN), or changing its type all surface the alert with the message `Missing field: {name}`. |
| **Transformer** | A source or target ODDRN that the transformer previously listed is no longer in its current source/target list. | Reported as `Missing source: {oddrn}` or `Missing target: {oddrn}`. |
| **Consumer** | An input ODDRN that the consumer previously listed is no longer in its current input list. | Reported as `Missing input: {oddrn}`. |
{% hint style="info" %}
**The first ingest of an entity never fires this alert.** Detection requires a previous (penultimate) version to compare against — there is nothing to "remove" relative to a non-existent prior state. Operators wiring up a new pipeline will see this alert begin to fire only from the second ingest onward.
{% endhint %}
`Backwards incompatible schema change` alerts do **not** auto-resolve — once raised they stay `OPEN` until an operator resolves them by hand. See [Alert lifecycle](#alert-lifecycle-statuses-resolution-cleanup) for the full lifecycle.
## Halt notifications per entity
Alert traffic on a single noisy data entity — a flaky job, an unstable test, a frequently re-shaping dataset — can drown out the rest of the queue. ODD lets owners **halt** notifications on one entity at a time, scoped per alert type, for a fixed duration. The halt is a temporary mute; the underlying detection pipeline keeps running, and notifications resume automatically when the timer expires.
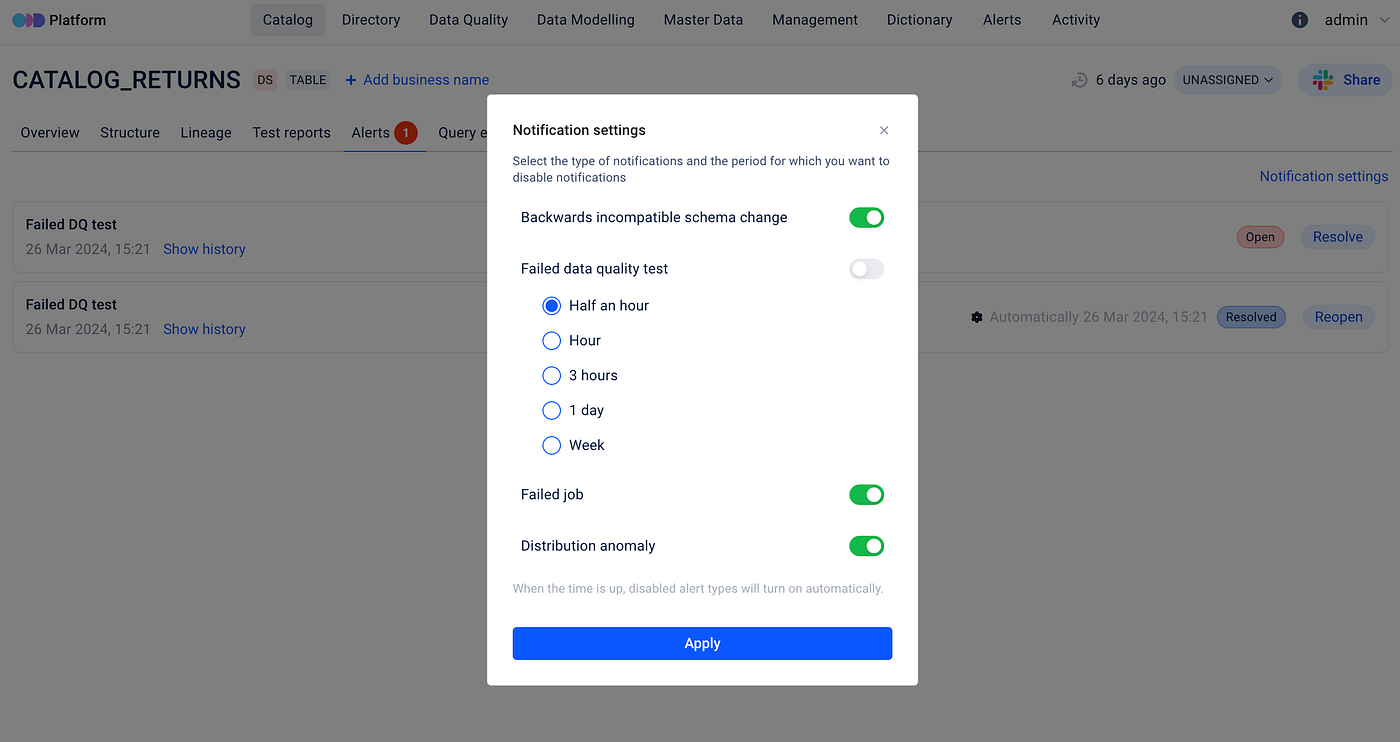
Halts are configured from the entity's `Notification Settings` button. Each of the four alert types is toggled independently — you can mute "Failed data quality test" for a dataset that's actively being repaired while keeping "Backwards incompatible schema" alerts firing for the same entity:
| Alert type toggle | What it suppresses |
| ---------------------------------------- | -------------------------------------------------------------------------------------------------------------------------------------------------------------------------------------------------------------------------------- |
| **Backwards incompatible schema change** | New schema-drift alerts during the halt window. |
| **Failed data quality test** | New alerts from quality-test failures. |
| **Failed job** | New alerts from job-run failures. |
| **Distribution anomaly** | *Currently unenforced — see* [*known limitation*](#distribution-anomaly-halt-is-currently-unenforced) *below. The toggle is exposed on the UI and persisted by the API, but the AlertManager webhook bypasses halt enforcement.* |
For each toggle, pick one of five durations:
* **Half an hour** (30 minutes)
* **Hour** (60 minutes)
* **3 hours**
* **1 day**
* **Week** (7 days)
The platform stores the halt as a future timestamp per alert type; once that timestamp passes, the toggle re-enables on its own without operator action.
Turning specific notifications off
{% hint style="info" %}
**Halts suppress new alerts only — they do not silence auto-resolution.** If an open `Failed job` alert is already firing on an entity and you halt that alert type, a subsequent successful run still flips the existing alert to `RESOLVED_AUTOMATICALLY` (see [Alert lifecycle](#alert-lifecycle-statuses-resolution-cleanup) above). Halts stop the **next new alert** of that type from being created; they don't freeze alerts already in flight.
{% endhint %}
The halt configuration is also exposed over the API — the `getAlertConfig` / `updateAlertConfig` endpoints, the four halt-timestamp field names, the ISO-8601 format requirement, the `null`-clears semantics, and the `ALERT_HALT_CONFIG_UPDATED` activity-feed event emission are all documented at [API Reference → Alerts → Per-entity halt-notification configuration](/developer-guides/api-reference/alerts.md).
### Distribution anomaly halt is currently unenforced
{% hint style="warning" %}
**The Distribution anomaly halt toggle has no effect on alert creation.** The toggle is exposed on the entity's `Notification Settings` UI and persisted by `PUT /api/dataentities/{data_entity_id}/alert_config`, but the AlertManager-driven path that creates Distribution Anomaly alerts (`POST /ingestion/alert/alertmanager` → the platform's external-alert handler) does not consult the halt config — new alerts continue to fire on a "halted" entity until the halt timer expires.
Until the platform fix lands, mute Distribution Anomaly noise at the **Prometheus Alertmanager** layer instead of relying on the per-entity halt — use a `silences` entry or a `route` matcher on the `entity_oddrn` label, or an `inhibit_rules` block in the Alertmanager configuration to suppress alerts while a parent condition is active.
The other three halt types (`Failed job`, `Failed data quality test`, `Backwards incompatible schema change`) are unaffected — their halts are enforced on the ingestion-driven alert-creation path.
{% endhint %}
## Known UX limitations
A handful of behaviours on the Alerts UI surface that operators encounter in normal use, all of them small individually but cumulative enough to warrant calling out. Each item below states what an operator might assume and what the UI actually does today.
* **A user without a user-owner association sees only the `All` tab — the cross-team feed.** The `My Objects`, `Downstream`, and `Upstream` tabs are hidden until the signed-in user is linked to an [Owner](/configuration-and-deployment/enable-security/authorization/user-owner-association.md), so the `All` tab is the *only* visible tab to such users, and the implicit framing is "alerts = platform-wide" rather than "alerts I can action." Set up the user-owner binding in **Management → Associations** to enable the `My Objects`, `Downstream`, and `Upstream` tabs.
{% hint style="info" %}
**Resolving or reopening an alert asks for confirmation, and the per-entity tab reflects the change without a refresh.** Clicking `Resolve` (or `Reopen`) opens a confirmation dialog before the status flips, so an accidental click no longer changes an alert's triage state; and on the entity's own Alerts tab the row updates in place the moment you confirm, rather than keeping the old status until a reload. The change is also recoverable: a resolved alert is retained for the full `resolved_alerts_days` window (see [Auto-cleanup of resolved alerts](#auto-cleanup-of-resolved-alerts)), so you can **Reopen** it before the window elapses.
{% endhint %}
* **The Notification Settings dialog has no optimistic-concurrency check.** Two operators editing the same entity's halt configuration in parallel both submit their edits; the second submission overwrites the first silently. There is no version field, no `If-Match` header, no "this configuration was changed by another user — reload?" warning. Coordinate halt-config changes externally (Slack ping before editing, change-management ticket) until the upstream concurrency guard ships.
## API surface
The platform's HTTP surface for alerts — the filterable global listing (`getAlertsList`) behind the **All / My Objects / Downstream / Upstream** tabs, the `getAlertCounts` badge call, the per-entity alert listing, the manual status-flip endpoint, and the halt-configuration endpoints (plus the now-deprecated legacy listing endpoints, kept working) — is documented at [API Reference → Alerts](/developer-guides/api-reference/alerts.md).
## Where to next
* For how alerts get out of the platform — Slack, email, generic webhook, the AlertManager inbound webhook → [Notifications](/features/active-platform-features/notifications.md).
* For the activity-feed events that record every alert state transition (`OPEN_ALERT_RECEIVED`, `RESOLVED_ALERT_RECEIVED`, `ALERT_STATUS_UPDATED`, `ALERT_HALT_CONFIG_UPDATED`) → [Activity Feed](/features/active-platform-features/activity-feed.md).
* For the operator-side configuration of the outbound alert-notification pipeline — `notifications.enabled`, the PostgreSQL logical-replication prerequisite, AlertManager setup → [Configure ODD Platform → Enable Alert Notifications](/configuration-and-deployment/odd-platform.md#enable-alert-notifications).